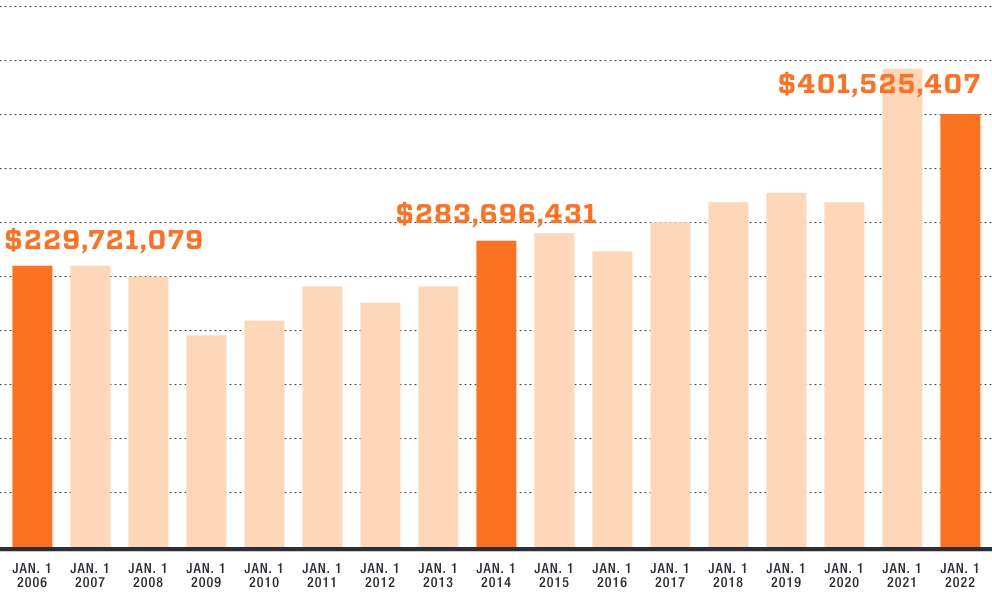
Total Endowment Market Value from 2006 to 2022

| For Year Ending |
Market Value |
| June 30, 2006 |
229,721,079 |
| June 30, 2007 |
260,809,144 |
| June 30, 2008 |
249,255,821 |
| June 30, 2009 |
194,705,411 |
| June 30, 2010 |
208,454,344 |
| June 30, 2011 |
243,124,894 |
| June 30, 2012 |
225,508,933 |
| June 30, 2013 |
241,583,964 |
| June 30, 2014 |
283,696,431 |
| June 30, 2015 |
288,995,887 |
| June 30, 2016 |
272,635,872 |
| June 30, 2017 |
298,858,771 |
| June 30, 2018 |
316,815,347 |
| June 30, 2019 |
328,567,827 |
| June 30, 2020 |
319,714,177 |
| June 30, 2021 |
443,743,590 |
| June 30, 2022 |
401,525,407 |
Endowment Market Value from 2006 to 2022
Continue Reading
All Articles
